Mass Spectrometry
We develop bespoke analysis tools for mass spectrometry data to help identify protein methylation sites. We also develop tools to allow us to identify proteins with unknown modifications.
Parenclitic Network Analysis
Parenclitic network analysis is a technique for analysing the differences between data sets - for example people with cancer versus those without. They allow us to analyse both individuals and general populations. We can use features of the network to predict (biomarkers) and understand the biology of disease.
Longitudinal Analysis
Longitudinal data analysis uses all historical data to predict a future event. For example, we have used our longitudinal algorithms to identify ovarian cancer in samples from an ovarian cancer screening trial (UKCTOCS) earlier than they were identified in the trial. Out algorithm uses changes in an individual, rather than comparing an individual to the general population, this personalised approach gives us better performance (senstivity/specificity) compared to other techniques.
Marketing
We are also working with companies to apply parenclitic and longitudinal analysis to other scenarios, such as online customer behaviour to improve market prediction and customer-stratification.
Data analysis
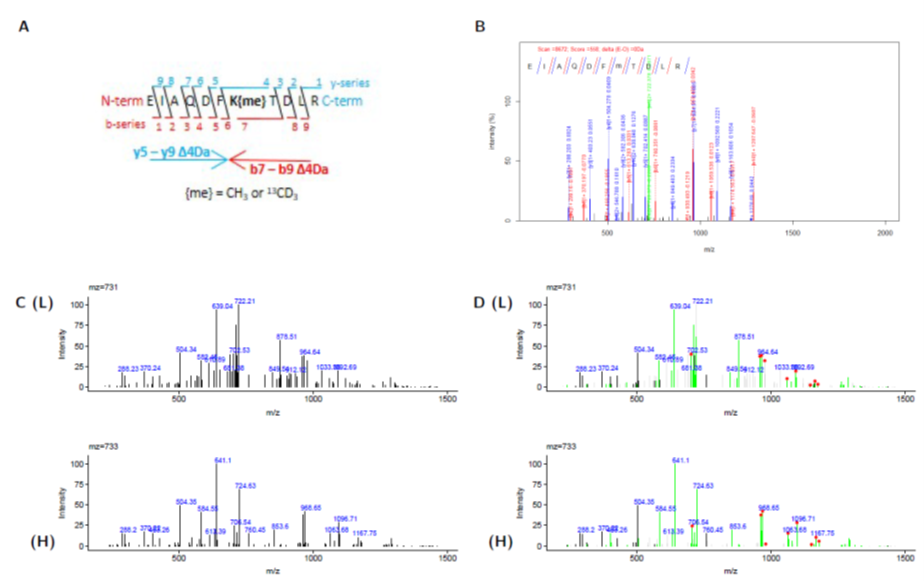
Mass Spectrometry
We use R to code our own bespoke data analysis tools for mass spectrometry data files. Recently, we published a tool, HiLight-PTM that highlights m/z peaks from peptide fragmentation (MS/MS) spectra that have matching masses, and those which have a predictable mass-shift owing to the incorporation of an isotopic label. Using this tool, we can extract pairs of MS/MS spectra that contain correlative fragments. Coupled to this, we use retention-time matching and compare the ratio of precursor isotopic peaks to match heavy/light peptide at both the MS1 and MS2 level. By doing this, we can interrogate when standard database searching fails (e.g. owing to poor fragmentation scans from co-isolation or low intensity). We also use experimental fragmentation matching to in silico fragment ions independant of precursor mass. In this way, we attempt to identify MS2 scans with unknown modifications or alterations to their primary sequence.
Data Analyis
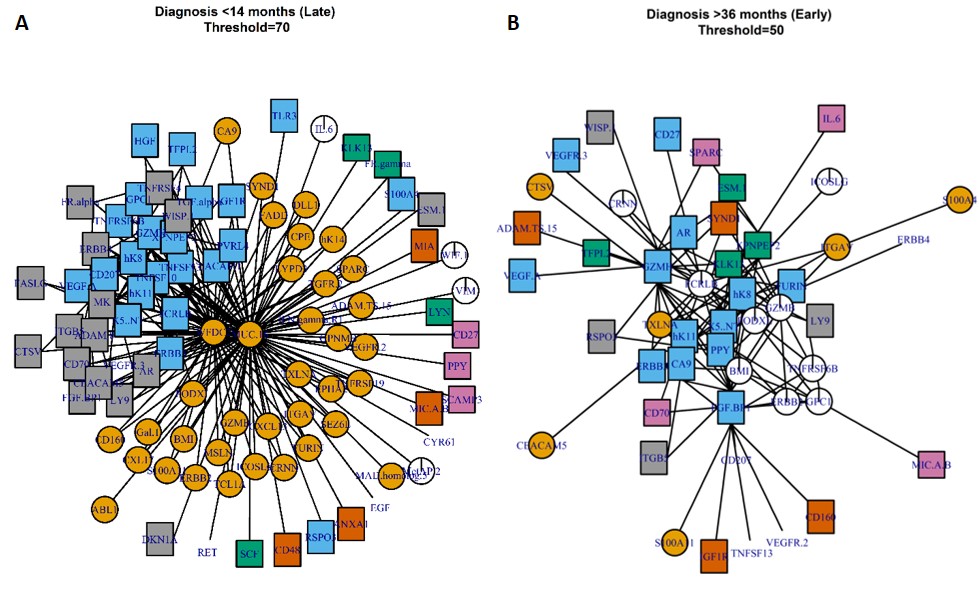
Parenclitic Network Analysis
Parenclitic networks are networks of differences between two populations or between an individual and a population. First described by Zanin (2014), we have adopted them to better-suit biological data. The networks are constructed by performing comparisons of all pairs of analytes within in a dataset. A 2 dimensional kernel density estimatation is constructed for each pair in a control population and the density at which the same pair of analytes in a test population or individual lies within the control population is determined. If the density is above a threshold, then this relationship is plotted within a graph structure (network). With Prof Zaikin and Dr John Timms (UCL), we have used the topology (shape) of these networks to predict ovarian cancer and inform on early biological events in the pathogenesis of this disease. We have recently been awarded an MRC/NIHR methodological development grant to explore the applications of parenclitic networks and combine them with deep learning and machine learning approaches for disease prediction. We have a number of collaborations regarding the use of parenclitic networks (e.g. aging), and are happy to share code and explain their benefits further.
Data Analysis
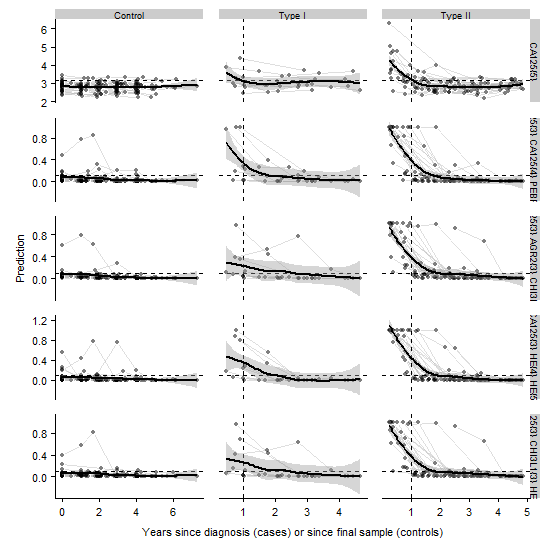
Londitudinal Analysis
Standard biomarker tests use a fixed threshold at which a biomarker signifies disease. This threshold is calibrated against a population to give the optimal ratio of false positives to false negatives. Many biomarkers naturally vary in concentration in healthy individuals such that individuals with a naturally low abundance of a biomarkers may not be diagnosed if the marker doesn’t increase above threshold with the onset of disease (and vice-versa). Longitudinal algorithms that can use screening data are able to circumvent this problem by identifying changes in an individuals’ baseline (i.e. a rate of change). For example, we have developed a number of longitudinal algorithms able to identify ovarian cancer from screening data with improved sensitivity/specificity over threshold models. In collaboration with Dr Blyuss, I am exploring the application of these techniques in other fields, such as changes to protein expression over the cell cycle and longitudinal market data.